The Data and the Details: Mapping Ontario School Board Funding Cuts
Generally, a family’s back-to-school preparations involve consulting school supply lists, figuring out bus routes, shopping for clothes and, for older kids, double-checking course selections. But over the past year, questions about education funding have created an additional layer of uncertainty.
It doesn’t help that, especially recently, education funding policy has felt like a cups-and-ball magic trick. Contradictory government announcements, the use of obtuse terms such as “attrition protection” and the moving of money between funding envelopes have created a general sense of confusion as to what is happening to schools in this province.
It shouldn’t be this way. Our children’s well-being depends on what happens to schools; we have the right and the duty to understand what’s going on. More to the point, if we’re to recognize the broader context and implications of shifts in policy and funding, we need to know what it looks like in our communities and across the province.
To demystify some of the discussion around education finances, CCPA Ontario recently looked at operating allocations (prior to capital adjustments) for school boards, comparing funding received for the 2017-2018 school year with estimates for the 2019-2020 school year. The comparison is adjusted for inflation and per-student calculations use estimated enrolment figures that were available as of August of 2019.
In addition to total and per-student figures, we looked at changes to the Learning Opportunities Grant (LOG). Initially set up to assist students living in socioeconomic contexts that increase the chances of lower academic achievement, this grant has been increasingly used to fund a variety of programs, including supports for students with learning challenges.
While this comparison doesn’t account for changes in infrastructure funding, class-size funding adjustments that will take effect throughout the year and cuts to public and community services that directly impact the quality of education, it is a straightforward way of finding out how much funding school boards will receive this year, in total and per student, in comparison to how much they received two years ago, the last complete school year before the current provincial government came to power.
The Results are Illuminating. Here are the Highlights:
- All school boards are experiencing cuts in total operating funding, per-pupil funding or, most commonly, both.
- For the 2019-2020 school year, the Ontario government is transferring $430 million less (adjusted for inflation) to school boards than the amount transferred in 2017-2018. That’s a (real) 2% cut in total operating funding.
- The percentage change in total funding for individual school boards ranges from -6% to +5%. Trillium Lakelands DSB (-6.5%) and York Catholic DSB (-6.3%) are seeing the highest percentage cut in total operating grants. Sixteen of the 72 school boards have an increase in total operating funding, but all 16 of these have cuts in per-student funding. In other words, the increase was smaller than what was necessary to make up for enrolment growth: they have less money per student overall.
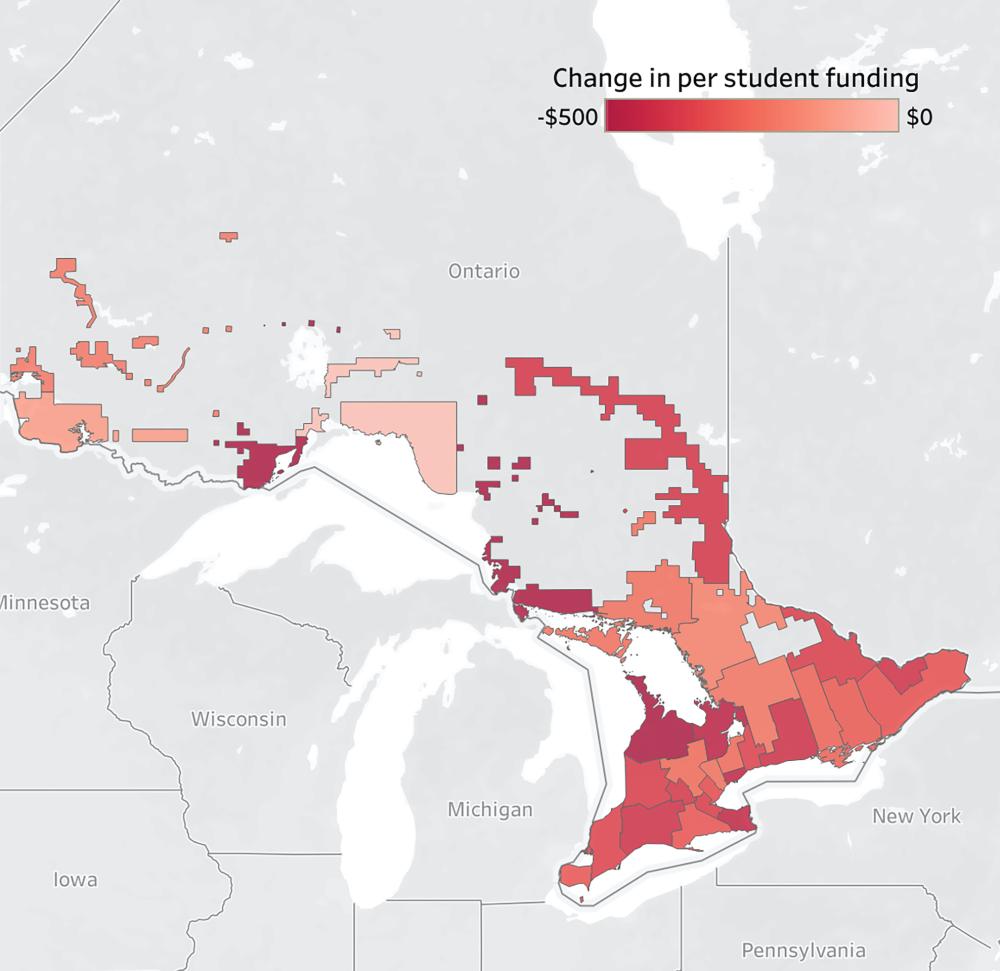
- The total average funding per student dropped by $375 (adjusted for inflation). That’s a 3% cut. Only four of the 72 school boards will see an increase in per-student funding. Some boards will shoulder steeper cuts. The Conseil des écoles publiques de l’Est de l’Ontario, for example, will see a reduction of $753 per pupil. Toronto DSB is losing $456 per student.
- These changes in total school board allocations will impact several specific funding envelopes. The 2019-2020 funding estimates include a 36% cut to the LOG, in comparison to 2017-2018 amounts (adjusted for inflation). No school board has been spared. Some boards are facing cuts as large as 76% (York Catholic DSB). Toronto DSB is losing 62% of this funding grant.
As parents, educators and the public respond to each policy announcement and try to determine what it means in their local schools and communities as well as on a broader scale – and most recently in the context of potential job action – it’s clear that closer examination of the available data is especially important.
To allow people to better visualize where these cuts are taking place in their communities, we took the additional step of building an interactive map which shows total funding change, total funding percentage change and per-student funding change for Ontario school boards across the province, mapped by school system (English public school boards, English Catholic school boards, Conseils scolaires publics, Conseils scolaires catholiques). We also included changes to the Learning Opportunities Grant on a board-by-board basis. (See behindthenumbers.ca/2019/09/04/ontarioschool-boards-map/.)
This method of displaying and analyzing data is particularly accessible and allows us to update it quickly as new numbers become available. It also allows us to “layer” data, providing a deeper understanding of what communities look like to people who live in them. This interactive, visual format provides us with a unique opportunity to help students, parents, educators and education workers understand what’s behind the changes they may be seeing to their classrooms, be it more students, fewer teachers, an inadequate number of EAs, less support for students with special needs or a reduced number of course selections.
More broadly, this sort of funding analysis illuminates several trends in Ontario education. For example, it helps put context to the fundraising letters and emails that are regularly sent home, additional built-in costs (for school supplies, or compensating for the cost of supply teachers required to cover for school team trips, for example) or parents tweeting that their kids’ timetables are being withheld until “optional” students fees are paid or proof of payment can be produced (and hey, schoolcashonline.com makes it easy!).
Additionally, it underscores the social media campaigns by private schools that focus on smaller classes, or prey on concerns about electives being cancelled in public schools. Many of the very things that educators and education workers are bargaining for, and that parents and students know improve the educational experience for everyone, like smaller classes, more one-on-one time and a more flexible environment in which to apply concepts learned in class, are precisely the things private schools advertise to potential customers.
Testing teachers in math is not a sales pitch for private school parents. Neither are overcrowded classrooms or mandatory e-learning in place of actual human contact with educators. Meanwhile, Ontario public schools are told to “do more with less,” and public school students are told they’ll be more resilient, with more opportunities to put “their best foot forward,” as a result of the very things that private school parents pay a premium to avoid.
The Canadian Centre for Policy Alternatives is committed to high-quality research about progressive economic and social policy solutions to the problems we are currently facing in our communities, our province and nationally. Our focus is on ensuring that research is accessible and provides people with tools to better understand how their current realities fit into a broader picture. And we put forward policy alternatives to make funding for public services more effective, more accountable and more equitable.
Ontario’s school board funding over the past two years is intended to help shed light on the numbers behind policy statements from the Ministry of Education and what they mean in dollar terms to boards and to students. The information we have provided in the interactive map can help educators, parents and others who are organizing to challenge education cuts or speaking with their MPP have a better understanding of the impact and realities of the numbers. We’re looking forward to continuing to provide information that increases awareness and understanding of the state of education funding in Ontario and helps more people engage in discussions about how we support our public schools, the students who attend them, the teachers and education workers employed there and the communities in which they’re located.
Ricardo Tranjan is Senior Researcher at CCPA Ontario and Erika Shaker is Director of Education and Outreach in the CCPA National Office.
